

As of 15.16.1 with V276, Data Logging is OFF by default. To turn logging on, click Data Logs to open up the Data Analyzer. Plug your ESC in, click Data, then click Download. When the data loads, it will be blank. Click Logging, then click Sample Rate and choose how frequently you would like the ESC to capture data. Faster rates take up more space, so you may need to adjust the sample rate if you need to record longer logs.
In this guide we’re going to take a quick look at the data logging feature of the GEN2 and later Tekin ESCs. In this tutorial we’re going to use the RS Spec (TT1155) and we’ll demonstrate some of the features used to diagnose problems and improve lap times at the International Indoor Champs (IIC) in Las Vegas. Note that in general these steps are identical in all of our GEN2+ line of ESCs equipped with data logging.
The Spec GT class features motors that have locked timing, and the user isn’t allowed to change the setting. The Final Drive Ratio (FDR) has a limit or a ceiling of 4.5 gear ratio. This class is set up to essentially eliminate the electronics from the performance equation, however, with the data logging feature we can see how other chassis changes, driving line changes, or gearing changes can improve the system.
In the first screen shot below (Fig.1) you see “Throttle” at the top (in blue) which is the throttle position measurement. This shows throttle and brake inputs from the radio, it MAY show numbers MORE than or LESS than 100 even at full throttle, depending on your radio settings when you first performed a radio calibrate on the ESC. In any case, it’s not hard to figure out what your full throttle reading is, the white arrows indicate a long “on” throttle time which corresponds to the straight away, which is typically run at full throttle. You can then see each lap represented, each time you see this long pulse. In Fig.1, each lap is indicated with a white arrow. These white arrows DO NOT appear in the data logging window.
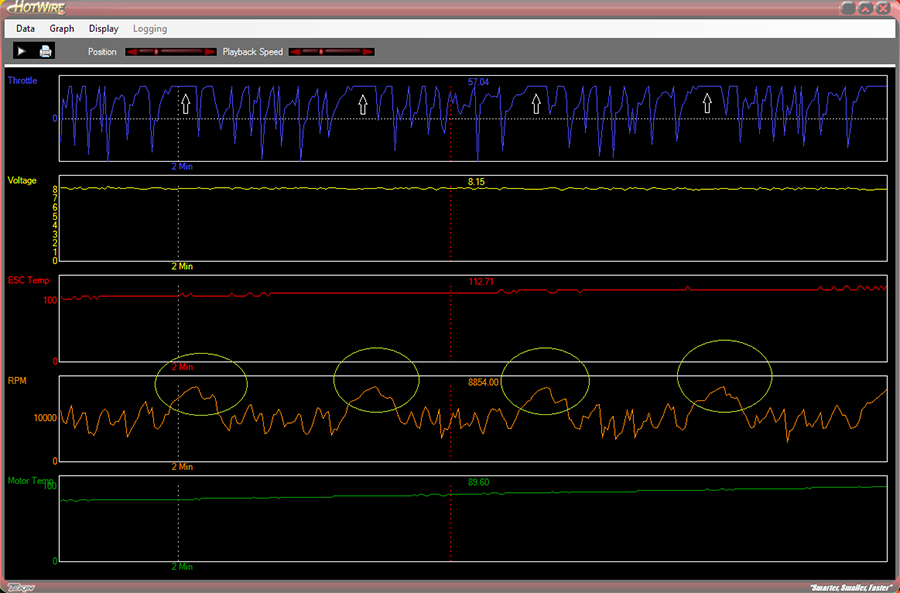
FIG. 1
Next is Voltage (yellow) which is, of course, battery supply voltage. Following that is ESC Temp (red) which again is a no‐brainer ‐this is the internal temperature of the ESC (display can be changed from Fahrenheit to Celsius on the display drop-down menu).
RPM is next (orange), now this is very important as we will soon explain, keep reading;“Motor Temp” (green) shows
the motor temp at the point and time you are on the run. Note that if you see a flat line here or odd numeric value here
that never changes, the motor you’re using probably isn’t
equipped with a sensor.
Click anywhere on the display to place a moveable cursor line (red) that shows all the readings at that point.
Dragging this cursor line, you can easily line up the straight away from “Throttle” with your RPM reading. What this
allows you to do is see your highest RPM on the straight away, lap after lap. So, for example, if you’re cutting the
corner leading onto the straight you may see lower RPMs
here than someone else who takes a wider line and carries more corner speed. Or in this particular case at IIC, we noted that the RPM was never flat lining (green circles in Fig. 1). In other words we were not revving out the motor even with a 4.5 FDR limit. In comparison, the 17.5 Stock TC guys who are not limited to anything more than ROAR legal motors and a ROAR Spec approved ESC were running FDRs in the 3.5-4.0 range, with a lot of motor timing.
This driver decided to make a gearing change and dropped 2 teeth on the pinion to see if that would top out the motor. So now let’s go over his next run:
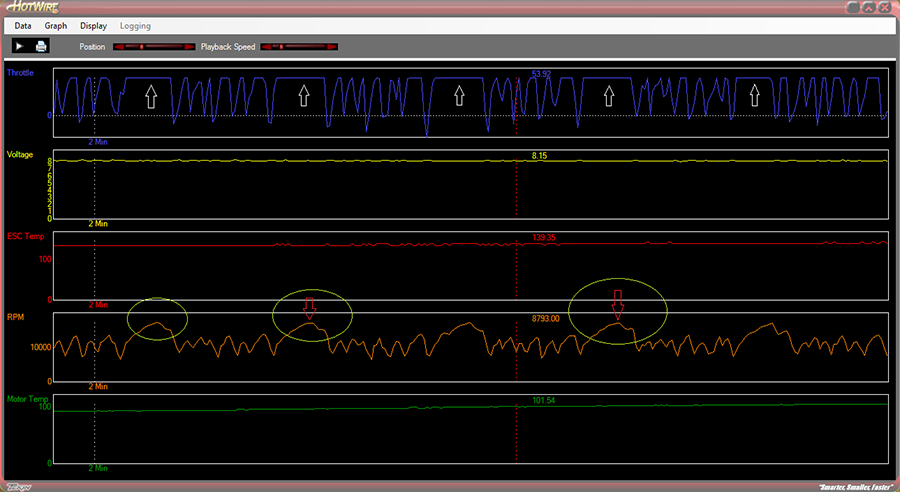
FIG. 2
The first thing we’re always looking for is low lap times. Let’s face it, nothing matters more than low lap times and so our goal in making changes is to drive lap times as low as we can consistently. So going over his 2nd run and knowing his lap times were consistently 0.1 o 0.2 seconds lower than his 1st run, we can look at the data and verify the gearing change was a factor. Looking at Fig. 2 we can see that now he’s
just getting some flat tops on his RPM reading. Knowing
his previous high RPM on Run 1 was 16,998 (by using the red grid) we compared that run to this one, where he is hitting 17,390 as his highest
RPM. We can see that he picked up nearly 400 RPM which lowered his lap times by 0.1 to 0.2 seconds a lap! On top of this, we also note that his battery voltage at the end of Run 1 was 7.70 Volts, and on Run 2 he finished with 7.89 volts. So again the change not only lowered lap times but his finish voltage was higher with the gear change as well.
After this word got out, no less than a dozen guys were
dropping their gearing.
A second driver we were working with required a different change. Let’s go over his runs:
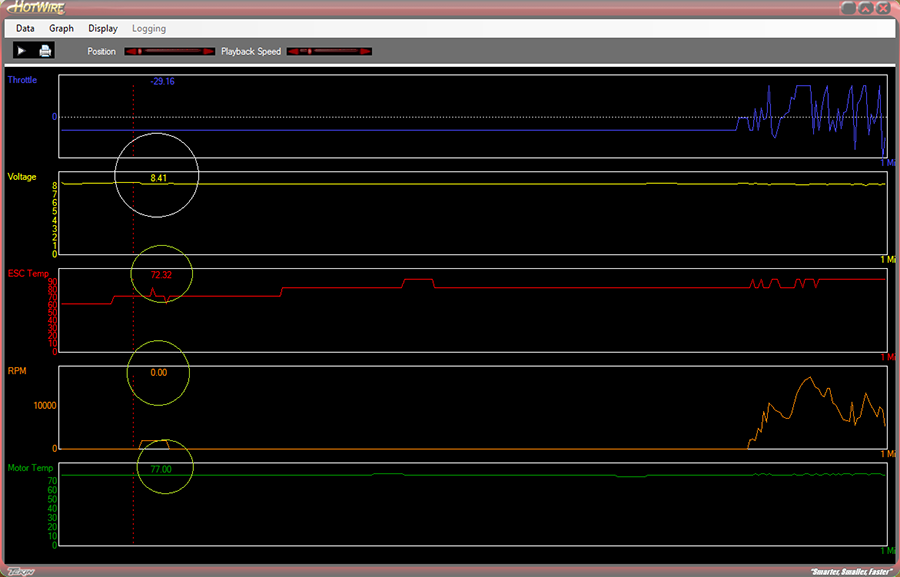
FIG 3.
In Fig. 3 note the circles. The first and most important here is the white one, his battery voltage. Our data logger begins recording as soon as the ESC is powered up. So this lets you see your “start voltage” before you run. His is good, 8.41. Now, this driver’s complaint was that his car didn’t look or feel as “punchy” as the other cars in his heat. Knowing that all the systems were matched we turned to the data logger to see what was different about his car. We didn’t see his driving lines prior to this so we used what information we had in front of us. Note that the green circles show no RPM, and ESC and Motor Temp settle at ambient room temperature. What we see over the next 90 seconds tells us a lot.
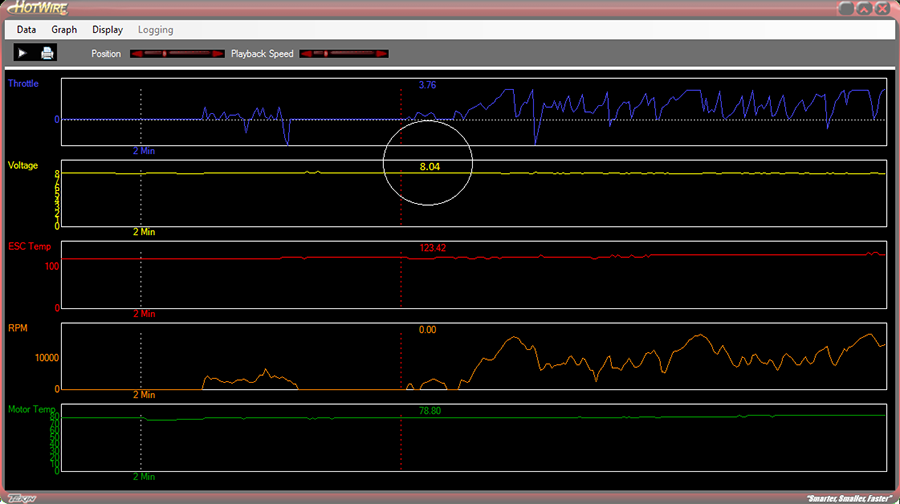
FIG 4.
Look closely at Fig. 4, do you see it? His battery voltage drops by 0.37V WITHOUT anything more than some staging RPM lining up for the loop! It turns out his battery was not bad but his car was equipped with 2 fans to cool the motor. These fans were dropping his battery voltage significantly before he even ran the car. And yes, 0.37V IS enough to make your car look less punchy than the rest of the field. So the suggestion; remove the fans. Look at the end of the run, his motor was only 120F, nowhere near needing exterior cooling. Next run was without fans. Let’s take a look.
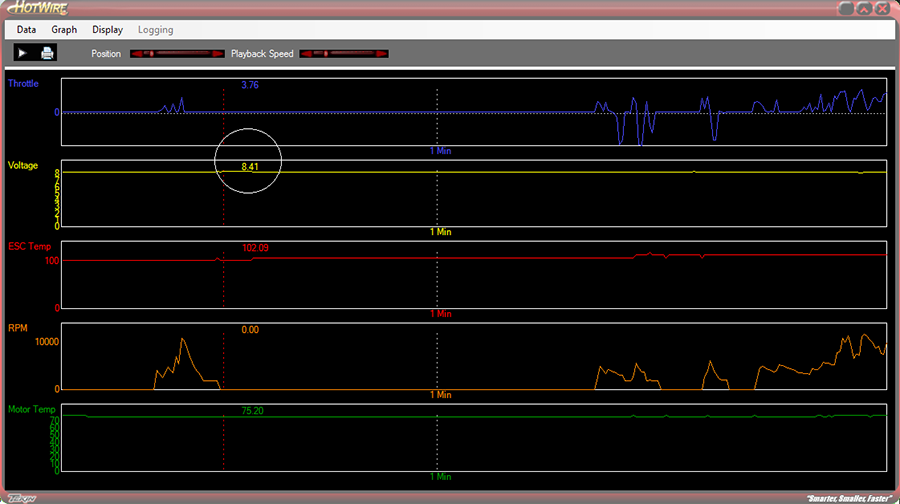
FIG 5.
Bingo! Even after a staging blip, in Fig. 5 he’s at 8.41V prior to turning some laps. Motor temp at the end of the run only climbed 20 degrees up to 140F or so. His RPMs were higher each and every lap compared to his previous run, his lap times came down 0.1 to 0.2 seconds compared to the previous run as well. He also TQ’d his heat, which was the direct result of this much appreciated improvement.
These are just two examples of what the data logging feature on the GEN2 Tekin ESCs can do for you. Tekin Race Team Manager Randy Pike offers a few other quick notes that will help you get the most out of this software;
- The more items you’re recording, the less runtime you can
record. So if you record all the data (throttle, voltage, esc temp, rpm, motor temp) you will get around 6-8 minutes if you cleared the memory prior to running the car. The two largest memory offenders are Throttle position and RPM. They’re the most active and therefore take the most memory. I often turn off throttle position to achieve a longer recording as I find it’s the least necessary when tuning my car. I know the layout I’m recording on and don’t need to see the straight away.
- To assure you get the last run each and every time, CLEAR the memory before you set the car down. This is quick and easy, its done by powering up the car, then holding down the “INC” button for about 3-5 seconds. You will hear an audible chime sequence, let go once it starts. The ESC will re-arm and you’re ready to go!
- If you’d like to see if your memory is clear, this is also easy to do. Power up the car, press and release the “INC.” button once, the more illuminated LEDs shown, the more memory that’s taken up. So one LED shown is a CLEAR memory.
- Every time the power is cycled the recording is started and stopped. So if you do a slipper test or dope your tires using the ESC/motor, the system records this. So if you do this enough times you can fill up the memory tank. Each run will be stored under the “Graph” menu at the top of the display window. Each “run” can be chosen and viewed.
- Not all motors on the market today are equipped with a temperature sensor. So if you see odd data and or a flat line on the motor temp stream, your motor likely isn’t equipped or it’s not functioning properly.
- You can adjust the length of the time on the display, and the temperature conversion, English or Metric. You can also choose 2 pole or 4 pole motors to correctly display the RPMs.
- You can adjust the resolution of the data logger as well. Note that the higher the resolution, the less amount of run time you can record.
- Data logs can be saved in a file folder of your choosing. I highly recommend saving them to your “My Documents” folder, as they’re easier to find later that way. You can also email these files to fellow racers, teammates, or Tekin for technical support, etc. You also do not need to be hooked up to the ESC to read these logs. You only need a Hotwire to be plugged into your computer or viewing device.
- The display can be printed out using the “Print” button, plus there is a “Play” button with adjustable playback speed that can help you to scroll through the run and visualize the track as the data is being displayed.

© Tekin, INC. | All Rights Reserved